The short answer: Google Ads puts you in front of people at the exact moment they search for what you sell. You can start getting clicks the same day, and you can measure what each one cost. The often quoted “$8 in profit for every $1 spent” is not that benefit. Google’s own methodology shows only $2 of that $8 comes from ads at all, and the research behind it dates to 2009.
TL;DR
- Google handled 91.1% of worldwide search traffic in August 2026, and Google’s advertising business took in $81.6 billion in the second quarter of 2026 alone. The audience is real.
- Across 13,474 US search campaigns measured from April 2025 to March 2026, the median cost per click was $5.42, the median conversion rate was 8.18%, and the median cost per lead was $66.69.
- Cost per lead across Google and Microsoft Ads fell year over year for the first time in five years, and conversion rates rose in 87% of industries.
- Google’s famous “$8 for $1” figure breaks down as $2 profit from ad clicks, plus $7 of imputed value from organic clicks Google assumes you also receive, minus $1 of spend. Only the $2 is attributable to advertising.
- Google Ads is worth it when your gross profit per closed customer comfortably exceeds your cost per lead divided by your close rate. For a home improvement contractor at a $90.92 cost per lead that is usually easy. For a restaurant at a $30.57 cost per lead and a few dollars of margin per order it usually is not.
- From February 2027 Dynamic Search Ads are gone and AI Max takes over, which means less keyword control and more reliance on Google’s matching. Plan for it now.
What is the benefit of advertising online with Google Ads?
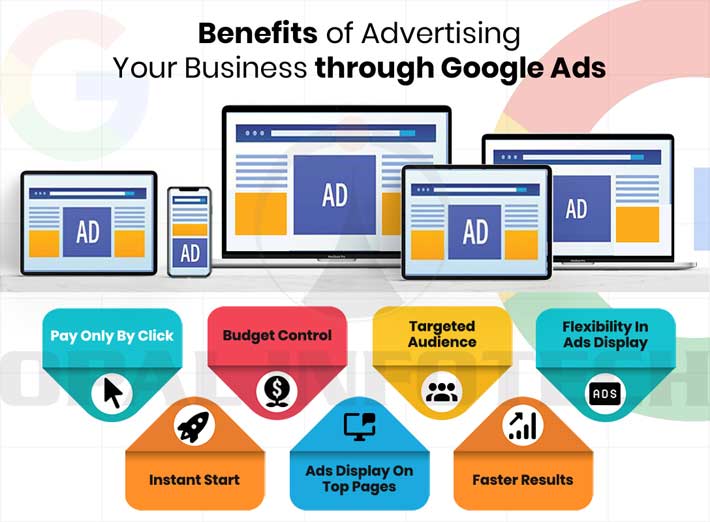
There are six benefits that hold up under scrutiny, and a few that get repeated far more often than the evidence supports.
The ones that hold up:
- You buy intent, not attention. A person typing “emergency plumber near me” has already decided to buy. No other advertising channel sells access to that moment at the moment it happens.
- It starts working in hours. An approved campaign can serve impressions the day it launches. Search engine optimization on a competitive term takes months, sometimes years.
- The cost of a customer is knowable. With conversion tracking configured properly, you can see what a lead cost and what a sale cost. Most offline advertising cannot give you that.
- You control the tap. Budgets can be set, raised, cut, or paused within minutes, and daily spend is capped.
- Geography is precise. A single location business can restrict delivery to a radius it can actually service.
- You reach people again. Remarketing lets you show ads to people who visited and did not buy, which is usually the cheapest audience you will ever pay for.
The ones that get overstated: “global reach” matters to almost nobody reading this. Most advertisers restrict targeting to one country or one city on purpose. “You only pay for engagement” is true but misleading. A click from someone who was never going to buy costs exactly the same as a click from someone who was. And “quick results” means quick traffic, not quick profit. The first sixty days of a new account are usually spent paying for data.
The “$8 for every $1” claim, and what it actually measures
Almost every article about Google Ads benefits cites a figure of $8 in profit for every $1 of ad spend. It comes from Google’s own economic impact reporting, and Google publishes the arithmetic behind it. That arithmetic is worth reading, because it does not say what most people think it says.
Google’s stated formula is: 2(spend) + 0.7 x 5 x 2(spend) – 1(spend) = 8(spend). Broken apart, it looks like this.
| Component | Value per $1 of ad spend | Where the number comes from |
| Profit from paid ad clicks | $2 | Hal Varian’s elasticity research, originally published in 2009 |
| Imputed profit from organic clicks | $7 | Google’s assumption that businesses get five organic clicks per ad click, valued at 70% of an ad click |
| Less the ad spend itself | -$1 | Subtracted once from the total |
| Figure Google reports | $8 | Sum of the three lines above |
Three things follow from that. First, $7 of the $8 is not advertising return at all. It is Google’s estimate of the value of free organic search traffic, which you would receive whether or not you ran a single ad. Second, the only part attributable to Google Ads is the $2, which is a 2:1 return before the spend is netted off, not 8:1. Third, the elasticity study underpinning the $2 is now seventeen years old, and the search results page it was measured on no longer exists in the same form.
None of this means Google Ads does not work. It means the headline number is a vendor estimate built on an assumption stack, and you should not plan a budget around it. Plan around your own numbers instead, using the method further down this page.
What Google Ads actually costs in 2026
The most useful public dataset on this is WordStream’s annual benchmark study. It draws on 13,474 US search advertising campaigns over the twelve months to 31 March 2026, with at least 52 active campaigns per category. All figures are medians rather than means, which keeps a handful of enormous accounts from distorting them.
Across every industry combined, the medians were a 6.64% click-through rate, a $5.42 cost per click, an 8.18% conversion rate, and a $66.69 cost per lead.
| Industry | CTR | Cost per click | Conversion rate | Cost per lead |
| Animals and pets | 7.49% | $4.06 | 16.22% | $31.50 |
| Apparel, fashion and jewelry | 6.64% | $4.44 | 4.50% | $97.51 |
| Arts and entertainment | 12.75% | $1.63 | 5.91% | $26.84 |
| Attorneys and legal services | 5.87% | $9.87 | 5.55% | $131.63 |
| Automotive, for sale | 8.28% | $2.27 | 6.01% | $44.26 |
| Automotive repair, service and parts | 5.56% | $4.35 | 15.51% | $29.96 |
| Beauty and personal care | 6.75% | $4.62 | 10.35% | $39.25 |
| Business services | 6.10% | $5.87 | 4.85% | $93.69 |
| Career and employment | 5.88% | $5.81 | 3.05% | $67.36 |
| Dentists and dental services | 5.66% | $8.00 | 10.67% | $72.97 |
| Education and instruction | 7.56% | $4.81 | 13.14% | $77.48 |
| Finance and insurance | 9.83% | $3.39 | 2.64% | $74.44 |
| Furniture | 6.57% | $3.97 | 2.99% | $106.70 |
| Health and fitness | 5.81% | $6.17 | 6.94% | $67.36 |
| Home and home improvement | 6.47% | $8.33 | 8.05% | $90.92 |
| Industrial and commercial | 6.57% | $5.87 | 8.20% | $75.19 |
| Personal services | 7.16% | $7.17 | 12.34% | $54.60 |
| Physicians and surgeons | 6.61% | $4.76 | 12.43% | $40.04 |
| Real estate | 7.61% | $3.22 | 3.70% | $102.51 |
| Restaurants and food | 6.83% | $2.05 | 8.05% | $30.57 |
| Shopping, collectibles and gifts | 8.28% | $4.14 | 4.01% | $49.40 |
| Sports and recreation | 8.75% | $2.77 | 7.69% | $44.26 |
| Travel | 9.32% | $2.14 | 5.83% | $44.70 |
One note on reading that table. The cost per lead column is not the cost per click divided by the conversion rate. Each column is a separate median, and medians do not multiply. Business services shows $5.87 per click and a 4.85% conversion rate, which implies roughly $121 per lead, while the reported median cost per lead is $93.69. Use the columns as independent reference points, not as a chain of arithmetic.
What changed between 2025 and 2026
The direction of travel in the 2026 data is mildly encouraging, which has not been true for several years. Cost per lead across Google and Microsoft Ads went down year over year for the first time in five years, and conversion rates improved in 87% of the industries measured. Most metrics were otherwise stable.
The movement was very uneven, though, and the averages hide it.
| Change | Biggest improvements | Biggest deteriorations |
| Click-through rate | Education and instruction +31.71%, beauty and personal care +18.21%, finance and insurance +18.01% | Health and fitness -19.08%, career and employment -10.50%, restaurants and food -9.89% |
| Cost per click | Education and instruction -22.79%, beauty and personal care -18.95%, automotive for sale -5.81% | Real estate +27.27%, personal services +23.41%, health and fitness +23.41% |
| Conversion rate | Beauty and personal care +32.34%, personal services +26.69%, animals and pets +24.10% | Career and employment -29.42%, automotive for sale -22.56%, business services -5.65% |
| Cost per lead | Travel -39.35%, beauty and personal care -34.95%, physicians and surgeons -29.54% | Automotive for sale +13.90%, health and fitness +7.26%, career and employment +7.26% |
If you are in real estate or health and fitness, your costs went up materially while the headline said costs went down. That is the practical argument for benchmarking against your own category rather than the overall average.
How to work out whether Google Ads is worth it for your business
This is four numbers and one division. You need your gross profit per closed customer, your close rate from lead to sale, and your category cost per lead. You also need to decide how long you will fund the learning period.
Worked example one, a home improvement contractor. Category cost per lead is $90.92. Suppose one lead in four becomes a job, so the cost per job is about $364. An average job of $4,000 at a 40% gross margin leaves $1,600 of gross profit. That is roughly $1,236 of contribution per job after the advertising cost. Google Ads works here, and it would still work if the cost per lead doubled.
Worked example two, an independent restaurant. Category cost per lead is $30.57, which sounds cheap next to the contractor. But if a lead is one table booking, an average check of $35 at a 15% food and labor margin leaves about $5.25. You are paying $30.57 to earn $5.25. This only works if the first visit reliably produces five or six repeat visits. In that case you are buying a customer relationship rather than a booking, and you had better be able to prove the repeat rate before you fund it.
That is the whole test. Google Ads is not inherently good or bad value. It is expensive for businesses with low margins, low order values and no repeat purchase. It is excellent value where one closed customer is worth hundreds or thousands of dollars in gross profit. Attorneys pay $131.63 per lead and stay in the auction happily, because a single retained case pays for dozens of leads.
On budget, a rough floor falls out of the same arithmetic. At the overall median $5.42 cost per click and 8.18% conversion rate, one conversion takes roughly twelve clicks and about $66 of spend. Automated bidding needs a meaningful number of conversions each month before it has anything to learn from. That puts most accounts in the low four figures per month before the results are signal rather than noise. That is a derivation from the benchmark medians, not a Google published minimum, and your own category numbers will move it.
Who should not run Google Ads
Being direct about this saves money.
- Businesses with no conversion tracking. Without it you are buying traffic blind and none of the measurement benefits apply. Fix tracking first.
- Products nobody searches for. Search advertising harvests existing demand. If your category has no search volume because people do not know the solution exists, you need demand creation, not search ads.
- Very thin margins with no repeat purchase. See the restaurant example above.
- Anyone who cannot fund at least three months. Turning a campaign off in week three, before it has enough conversion data to optimize, reliably produces the worst possible result: you paid for the learning and captured none of it.
- Businesses that cannot answer the phone. Paying for high intent clicks and then letting the inquiry sit for two days is the most expensive mistake in the channel.
The 2026 change most advertisers have not planned for
Google is moving search advertising toward AI Max, and it is not optional for long. The September 2026 auto-upgrade already moved campaigns using automatically created assets and campaign-level broad match onto AI Max. Dynamic Search Ads follow in February 2027, when Google automatically upgrades any remaining DSA campaigns, having extended the original September 2026 date in response to advertiser feedback. New DSA ad group creation is permanently removed in that same February window, so DSA remains available to run and create until then.
Google states that AI Max campaigns using the full feature set see on average 7% more conversions or conversion value, at a similar cost per acquisition or return on ad spend. The full set means search term matching plus text customization plus final URL expansion, and the comparison is against search term matching alone. That is Google’s own figure for a narrow comparison, so read it as such. A 7% lift is real but modest. The trade you make for it is less control over which queries you pay for and which page a click lands on.
In September 2026 Google also announced a unified reporting view that shows the triggering search terms, the creative assets shown, and the final landing page together as one journey. Google had not dated its availability at the time of writing, but it matters: once AI Max is making the matching, creative, and landing page decisions per impression, advertisers need a single report that shows all three or they cannot tell what they actually bought.
The practical advice is to upgrade a test campaign voluntarily now rather than being migrated automatically later, and to watch your search terms report closely during the first month. Google’s Chief Business Officer described AI Max in the second quarter 2026 earnings call as enabling advertisers to target searches that were previously hard to monetize, which is worth reading twice. Queries that were previously hard to monetize were often hard to monetize because they did not convert.
Is the audience still there in the age of AI answers
This is the fair question to ask in 2026, and the numbers say yes, at least on the advertising side. Google Search and other revenue reached $63.27 billion in the second quarter of 2026, up from $54.19 billion a year earlier. Total Google advertising revenue for the quarter was $81.63 billion against $71.34 billion, with YouTube contributing $11.06 billion and the Google Network flat at $7.30 billion. Google’s share of worldwide search traffic stood at 91.1% in August 2026, with Bing second at 4.5%.
One caution on interpreting that. Advertising revenue growing does not tell you that organic clicks to individual websites are growing, and there is good reason to think the opposite is happening as AI generated answers absorb informational queries. If anything, that strengthens the case for paid search relative to organic search, because the paid slots remain paid slots. It also weakens the $8 for $1 calculation further, since that figure leans on an assumption of five organic clicks arriving for every paid click.
Key terms in one line each
- Cost per click (CPC): what you pay each time someone clicks your ad.
- Click-through rate (CTR): clicks divided by impressions, expressed as a percentage.
- Conversion rate (CVR): the share of clicks that complete the action you are tracking.
- Cost per lead (CPL): total spend divided by the number of leads generated.
- Cost per acquisition (CPA): total spend divided by conversions, used interchangeably with cost per conversion.
- Return on ad spend (ROAS): revenue generated divided by advertising spend, usually shown as a ratio or percentage.
- Ad Rank: the score Google uses to decide whether your ad shows and in what position, combining your bid, ad and landing page quality, and context.
- Quality Score: Google’s 1 to 10 diagnostic of expected click-through rate, ad relevance and landing page experience.
- Search terms report: the actual queries that triggered your ads, as distinct from the keywords you chose.
- Negative keyword: a term you instruct Google never to match your ads against.
- Remarketing: advertising to people who already visited your site or used your app.
- Performance Max: a goal based campaign type that serves across Search, Display, YouTube, Discover, Gmail and Maps from one set of assets.
- AI Max for Search: Google’s 2026 set of search campaign features combining keywordless matching, automated text customization and final URL expansion.
- Dynamic Search Ads (DSA): the legacy campaign type that generated headlines from your website content, being retired in favor of AI Max.
- Google Display Network: the roughly two million sites, apps and videos where Google can place display ads.
Frequently asked questions
Is Google Ads worth it for a small business?
It depends almost entirely on your gross profit per customer. If one closed customer is worth several hundred dollars or more in gross profit, the 2026 median cost per lead of $66.69 leaves plenty of room. If a customer is worth ten dollars and never comes back, it does not.
How much do I need to spend before the data means anything?
At the 2026 medians, roughly twelve clicks and $66 of spend produce one conversion. Automated bidding needs a reasonable number of conversions per month to optimize against, so most accounts need a monthly budget in the low four figures before results stop looking like random noise. Your category cost per click will move that number up or down considerably.
Does Google Ads really return $8 for every $1 spent?
No, not in the way the claim is usually repeated. Google’s own published methodology attributes $2 of that $8 to ad clicks and $7 to an assumed volume of organic clicks valued at 70% of an ad click, then subtracts the $1 of spend. The advertising component is 2:1, and it rests on elasticity research first published in 2009.
Is Google Ads better than SEO?
They answer different questions. Google Ads buys traffic now at a known price and stops the moment you stop paying. SEO is slow, uncertain in timing, and compounds. Most businesses that can afford both should run both, and use the search terms report from ads to decide what to write about organically.
Why is my cost per click higher than the benchmark for my industry?
Usually one of four reasons. Your keywords are broader than your competitors’. Your Quality Score is low because the ad copy and landing page do not match the query. You are competing in an expensive city. Or your category benchmark is a median hiding a very wide spread: attorneys sit at a $9.87 median, and individual practice area terms run far above it.
Can I run Google Ads without an agency?
Yes, and small accounts often should, because agency fees on a $1,500 monthly budget can consume the margin the campaign was meant to produce. What you cannot skip is conversion tracking, a negative keyword list you actually maintain, and a weekly look at the search terms report.
What is a good ROAS for Google Ads?
There is no universal figure, because the answer depends on your gross margin. A business with a 20% margin needs roughly 5:1 revenue to ad spend just to break even on the advertising, while a business with an 80% margin breaks even near 1.25:1. Work out your own break-even first, then set a target above it.
Do I still control keywords in 2026?
Less than you used to, and less again after February 2027 when Dynamic Search Ads are retired into AI Max. Exact match keywords still exist, but keywordless matching, broad match and final URL expansion mean a growing share of your spend goes to queries you did not pick. Negative keywords and the search terms report are now the main levers of control.
Is Google Ads still worth it now that AI answers appear above the results?
For paid search, the evidence so far says yes. Google’s search advertising revenue grew from $54.19 billion to $63.27 billion year over year in the second quarter of 2026, which is not the pattern of a channel being displaced. The bigger risk is to organic traffic, where AI generated answers can satisfy an informational query without a click.
The bottom line
The genuine benefit of advertising online with Google Ads is access to purchase intent at a measurable price, available almost immediately and adjustable at will. That is a real and unusual advantage, and it is worth paying for when your unit economics support it.
What it is not is a guaranteed multiplier. The $8 figure that appears in nearly every article on this subject is a vendor calculation in which the majority of the return comes from organic traffic you would have received anyway. Ignore it. Take your gross profit per closed customer and divide by your close rate. Compare the result against the cost per lead for your category in the table above. That answer is worth more than any benchmark or promotional statistic.
Sources
- WordStream, Google Ads Benchmarks 2026, 13,474 US search campaigns, April 2025 to March 2026.
- Google Economic Impact, Methodology, for the published derivation of the $8 per $1 figure.
- Alphabet Inc., Second Quarter 2026 Results, filed with the SEC.
- StatCounter Global Stats, Search Engine Market Share, August 2026.
- Google Ads and Commerce Blog, Dynamic Search Ads upgrading to AI Max.
- Google Ads Help, Benefits of online advertising and Google Ads.
Figures in this article were checked against the primary sources listed above in October 2026. Advertising benchmarks change every year and Google Ads product rules change more often than that, so verify current costs and campaign requirements in your own account before committing budget. Nothing here is financial advice.

The Teck Hustlers editor oversees publishing, fact-checking and corrections across Teck Hustlers, making sure every story on technology, business, finance and gaming meets our editorial standards before it goes live.