Written by Admin Alex · Fact-Checked by M.Ali · Info Verified November 2026
We review and update this article regularly as new information becomes available.
Gold has been a strong hedge against inflation over decades, but a weak and unreliable one over months or single years, because its price follows real interest rates more closely than it follows consumer prices.
TL;DR
- Since August 1971, U.S. consumer prices have risen about 8 times. Gold has risen about 115 times, from $35 to roughly $4,046 an ounce in November 2026.
- The path was very uneven. Gold lost value in real terms through the 1980s and 1990s while inflation kept running.
- A buyer at the January 1980 peak of $850 waited until 2008 to break even in dollars, and until 2025 to break even after inflation.
- The main driver is the real interest rate: bond yields minus inflation. Negative real rates tend to lift gold. Rising real rates tend to push it down.
- 2026 is a live example. Gold hit a record near $5,590 in January, then fell about 25% as U.S. inflation climbed and the Federal Reserve turned hawkish.
- Treat gold as a long-horizon hedge against currency debasement and policy mistakes, not a month-to-month inflation tracker.
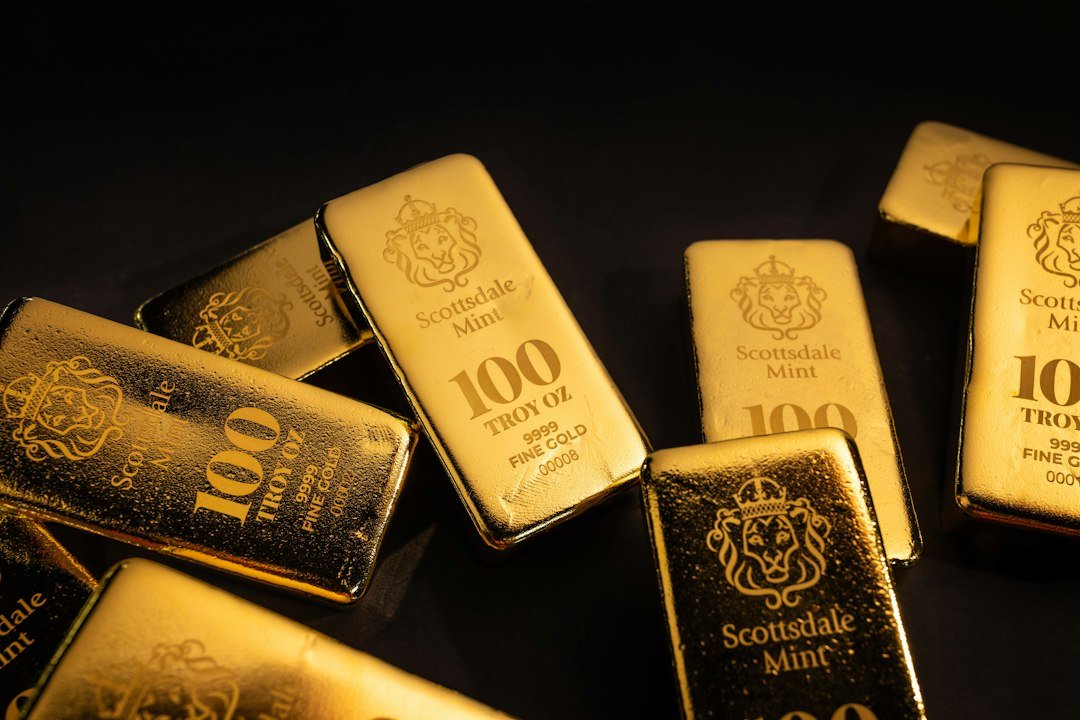
Ask ten people why they own gold and most will say “inflation.” It is one of the oldest ideas in personal finance. It is also one of the most misunderstood. People buy gold after a hot inflation report, watch the price go nowhere for a year, and sell in frustration. Others hold through a decade and do very well.
Both groups are looking at the same metal. The difference is the timeframe, and the one variable most people never check. This guide walks through 55 years of data to show when gold has protected purchasing power, when it has failed, and why.
Key Terms in One Line Each
- Inflation: the rate at which the general price level rises, reducing what a dollar buys.
- Consumer Price Index (CPI-U): the Bureau of Labor Statistics measure of prices paid by urban U.S. consumers, the most quoted U.S. inflation gauge.
- Inflation hedge: an asset whose value tends to rise when prices rise, preserving purchasing power.
- Nominal price: the price in today’s dollars, with no adjustment for inflation.
- Real (inflation-adjusted) price: the price restated in constant dollars so different years can be compared fairly.
- Real interest rate: a bond yield minus expected inflation. It is the true return on holding “safe” cash or bonds.
- TIPS: Treasury Inflation-Protected Securities. The 10-year TIPS yield is the market’s most watched real rate.
- Opportunity cost: the income you give up by holding gold, which pays no interest or dividend.
- Bretton Woods: the post-war system that fixed the dollar to gold at $35 an ounce until August 1971.
- Currency debasement: a loss of a currency’s value caused by rapid money creation, large deficits or a collapse in confidence.
- Spot price: the current market price for immediate delivery of one troy ounce of gold.
- Central bank reserves: gold and foreign currency held by national central banks, now a major source of gold demand.
What Does “Gold as a Hedge Against Inflation” Actually Mean?
An inflation hedge should keep pace with rising prices. If groceries, rent and fuel cost 30% more, a good hedge should be worth at least 30% more too. That is the promise people attach to gold.
The logic is simple. Governments can print more dollars. Nobody can print more gold. Mine supply grows slowly, so over long periods gold tends to hold value as paper money loses it.
The catch is the word “tends.” Gold does not watch the CPI report. Its price is set by buyers and sellers who are weighing many things at once: interest rates, the dollar, fear, and central bank demand. Inflation is only one input, and often not the biggest.
Gold vs Inflation Since 1971: The Long View
The modern gold market starts on August 15, 1971. That day, President Nixon ended the dollar’s convertibility into gold at the official price of $35 an ounce. From then on, gold floated freely against the dollar.
Here is how the full period looks, using Bureau of Labor Statistics CPI data and market gold prices.
| Measure | August 1971 | Late 2026 | Change | Source |
|---|---|---|---|---|
| CPI-U index (1982-84 = 100) | 40.8 | 337.5 (Oct 2026) | About 8.3x | BLS |
| Gold price per ounce | $35 (official) | $4,046 (Nov 10, 2026 close) | About 115x | U.S. Treasury; market data |
| $1,000 in 1971, kept in cash | $1,000 | Buys about $121 of 1971 goods | -88% purchasing power | Calculated from BLS CPI |
| $1,000 in 1971, held in gold | $1,000 | About $115,600 | Far ahead of inflation | Calculated |
On the long view, the verdict is clear. Gold did far more than keep up with inflation. It outran it by a wide margin. If the question is “does gold preserve wealth across generations,” the data says yes.
But almost nobody buys gold and holds it for 55 years. The more useful question is what happened along the way.
Decade by Decade: Where the Hedge Worked and Where It Failed
Break the same period into decades and a very different picture appears.
| Period | Gold price change | CPI change | Did gold beat inflation? | Main backdrop |
|---|---|---|---|---|
| 1970s | About +1,350% ($35 to $512) | About +103% | Yes, hugely | Oil shocks, negative real rates |
| 1980s | About -22% ($512 to $401) | About +64% | No | Volcker rate hikes, high real rates |
| 1990s | About -28% ($401 to $290) | About +33% | No | Low inflation, strong stocks, central bank selling |
| 2000s | About +275% ($290 to $1,087) | About +28% | Yes | Falling real rates, weak dollar, 2008 crisis |
| 2010s | About +39% ($1,087 to $1,515) | About +19% | Yes, modestly | Near-zero rates, quantitative easing |
| 2020 to Nov 2026 | About +167% ($1,515 to $4,046) | About +31% | Yes | Pandemic stimulus, central bank buying, 2026 rate shock |
Gold figures use approximate year-end London prices. CPI figures are December-to-December changes in BLS CPI-U, with October 2026 for the latest period. Percentages are rounded.
Two of the six periods were outright failures. In the 1980s and 1990s, consumer prices rose almost 120% combined, while gold fell by close to half. Anyone who believed gold tracked inflation year by year lost real money for two decades.
The 1980 peak: a 45-year wait
Gold peaked at $850 an ounce in January 1980. A buyer at that top did not see $850 again until January 2008, a 28-year wait in plain dollars.
Adjusted for inflation, the wait was far longer. Using BLS CPI data, $850 in January 1980 equals roughly $3,700 in October 2026 dollars. Gold did not clear that real level until 2025. That is about 45 years to recover purchasing power from a single bad entry point.
Why Gold Follows Real Interest Rates More Than Inflation
If inflation alone drove gold, the 1980s would have been a great decade for it. Inflation was high early in that decade. So why did gold collapse?
The answer is the real interest rate. Gold pays no interest. Holding it means giving up whatever you could earn in a Treasury bill or bond. When that safe return is high after inflation, gold looks expensive to hold. When the safe return is zero or negative, gold costs nothing to hold by comparison.
| Real rate environment | Example period | What gold did |
|---|---|---|
| Strongly negative (inflation above bond yields) | 1970s; 2020 to 2021 | Rose sharply |
| Strongly positive (yields far above inflation) | Early 1980s under Fed Chair Paul Volcker | Fell for years |
| Near zero or negative with low inflation | 2010s quantitative easing | Rose despite low CPI |
| Rising fast from negative to positive | 2022; mid-2026 | Stalled or fell despite high CPI |
This explains the puzzle that confuses many new buyers. Gold rose in the 2010s even though measured inflation was low, because rates were pinned near zero. Then in 2022, U.S. CPI inflation hit 9.1% in June, the highest in four decades. Gold should have soared. Instead it fell from above $2,000 in March to around $1,620 by November, as the Federal Reserve raised rates at the fastest pace since the 1980s and the 10-year TIPS yield swung from about -1% to well above +1%.
Academic work backs this up. In their widely cited paper “The Golden Dilemma,” Claude Erb and Campbell Harvey found that gold’s short-term link to inflation is weak, even though its long-run record is strong.
The 2026 Test Case: Rising Inflation, Falling Gold
2026 is a textbook example playing out in real time. Gold set an all-time high of about $5,590 an ounce in late January 2026, driven by safe-haven buying and heavy central bank demand.
Then inflation picked up. An energy shock tied to the Iran conflict and lingering tariff effects pushed U.S. inflation to a three-year high by June, according to Euronews. BLS data shows the CPI rising 0.6% in September and 0.4% in October 2026.
A simple “gold equals inflation” view says gold should have rallied. It did the opposite. Gold fell about a quarter from its January record. The reason was the Federal Reserve. New Fed Chair Kevin Warsh signaled a hawkish stance, and markets began pricing rate hikes. Bank of America analyst Michael Widmer noted that the rising probability of hikes was “closely correlated with a decline in gold prices.”
| Data point (2026) | Figure | Source |
|---|---|---|
| Record intraday gold price, January 28 | About $5,589 per ounce | StoneX Bullion |
| Gold close, November 10 | $4,045.79 per ounce | PriceGold.net |
| Decline from record | About 27% | Calculated |
| CPI-U monthly change, September | +0.6% | BLS |
| CPI-U monthly change, October | +0.4% | BLS |
| CPI-U index level, October | 337.511 | BLS |
The lesson is not that gold has stopped working. It is that gold reacts to what central banks do about inflation, not to the inflation number itself.
Currency Debasement vs Everyday Price Inflation
It helps to separate two kinds of inflation, because gold treats them differently.
Debasement inflation comes from the money itself losing value. A government prints heavily, runs large deficits, or loses the market’s trust. Gold has a strong record here. It has surged in local-currency terms in countries such as Turkey, Argentina and Venezuela during currency crises, and in the U.S. during the 1970s.
Supply-shock inflation comes from a disruption in goods, such as an oil embargo or a shipping crisis. Here gold’s response depends on the central bank’s reaction. If the bank lets real rates fall, gold rises. If it hikes hard, as in 1980 or 2026, gold can fall even while prices climb.
Central Banks: The New Driver Behind Gold Prices
One major change since 2022 is who is buying. Central banks, especially in emerging markets, have become huge buyers as they diversify reserves away from the U.S. dollar.
| Year | Central bank net gold purchases | Source |
|---|---|---|
| 2022 | Above 1,000 tonnes | World Gold Council |
| 2023 | Above 1,000 tonnes | World Gold Council |
| 2024 | 1,092 tonnes | World Gold Council |
| 2025 | 863 tonnes | World Gold Council, Gold Demand Trends Full Year 2025 |
This demand helps explain why gold held up through 2023 and 2024 even when real rates were positive, which broke the old pattern for a while. It is a reminder that no single factor explains gold. Real rates are the strongest long-run signal, but they are not the only one.
How to Use Gold Sensibly Against Inflation
None of this is investment advice. It is a framework for setting realistic expectations.
- Think in years, not quarters. Gold’s record as a store of value looks steady over 10 to 20 years and close to random over 3 to 12 months.
- Watch real yields, not just CPI. The 10-year TIPS yield, published daily by the U.S. Treasury and FRED, tells you more about gold’s direction than a single inflation print.
- Avoid chasing headlines. Buying right after a hot CPI report, then selling a year later, is the most common way new buyers lose money in gold.
- Size it as insurance. Many planners treat gold as a modest slice of a diversified portfolio, not the core of it.
- Check long-term charts before buying. A multi-decade view, such as the historical data on SD Bullion’s gold price page, which goes back to 1968, shows the long cycles far better than a one-year chart.
- Know your costs. Physical gold carries dealer premiums, storage and insurance costs. Gold ETFs carry annual fees. Both eat into returns.
Gold vs Other Inflation Hedges
| Asset | Strength against inflation | Main weakness |
|---|---|---|
| Gold | Strong over decades, strong in currency crises | No income, weak when real rates rise |
| TIPS | Principal adjusts directly with CPI | Prices fall when real yields rise |
| Stocks | Companies can raise prices over time | Can fall sharply in high-inflation shocks |
| Real estate | Rents and values often rise with prices | Illiquid, sensitive to mortgage rates |
| Commodities | Often lead inflation in supply shocks | Very volatile, no income |
| Cash | Safe in nominal terms | Loses purchasing power when real rates are negative |
Frequently Asked Questions
Is gold a good hedge against inflation?
Over long periods, yes. Since 1971 gold has risen about 115 times while U.S. consumer prices rose about 8 times. Over shorter periods it is unreliable. Gold lost value in real terms through the 1980s and 1990s, and it fell in 2022 and 2026 even as inflation rose.
Why is gold considered a hedge against inflation?
Gold’s supply grows slowly and cannot be created by governments, unlike paper money. When a currency loses value through heavy money creation, gold tends to hold its purchasing power. That makes it a store of value over long periods.
Does gold go up during inflation?
Not always. Gold tends to rise when inflation is high and interest rates stay low, so real rates are negative. When central banks raise rates faster than inflation, as in the early 1980s, 2022 and mid-2026, gold often falls despite rising prices.
How does gold protect against inflation?
Gold protects purchasing power by holding its value as the currency weakens. It works best against currency debasement and long periods of negative real interest rates. It works poorly against short spikes in consumer prices that trigger aggressive rate hikes.
Why did gold fall when inflation was high in 2022?
The Federal Reserve raised rates at the fastest pace in four decades. Real interest rates swung from deeply negative to positive. Since gold pays no interest, higher real yields made bonds more attractive, and gold fell from above $2,000 to around $1,620.
Why is gold falling in 2026 even though inflation is rising?
Gold fell about a quarter from its January 2026 record as markets priced in Federal Reserve rate hikes. Rising real yields and a hawkish Fed outweighed the inflation headlines, which is the same pattern seen in 1980 and 2022.
Is gold a good hedge against recession?
Gold often holds up in recessions because central banks usually cut rates and investors seek safety. It rose during the 2008 financial crisis and in 2020. It is not guaranteed, though, and it can fall in the early panic phase when investors sell everything for cash.
Should you buy gold during inflation?
That depends on your timeframe and goals. Buying gold as a long-term store of value has a strong record. Buying it as a quick trade on one inflation report has a poor one. A licensed financial professional can help you decide whether it fits your portfolio.
What is the best inflation hedge: gold, TIPS or stocks?
There is no single best option. TIPS track CPI directly. Stocks have beaten inflation over most long periods. Gold shines in currency crises and negative real rate periods. Many investors combine several to cover different kinds of inflation.
Bottom Line
Gold has earned its reputation as an inflation hedge, but only over the long run. Across 55 years it has protected and grown purchasing power far beyond the CPI. Across any single year, it has been loose enough to disappoint anyone expecting a tight match.
Two things matter most. First, watch real interest rates, not just inflation headlines, because gold follows what central banks do. Second, judge gold over years and decades, not quarters. Used that way, it is a sound hedge against currency decline and policy mistakes.
Disclaimer: This article is for general information only and is not financial or investment advice. Past performance does not guarantee future results. Prices, rates and rules change. Consult a licensed financial professional before making investment decisions.
Sources: U.S. Bureau of Labor Statistics, CPI October 2026; World Gold Council, Gold Demand Trends Full Year 2025; Euronews, June 2026; StoneX Bullion; PriceGold.net; Erb and Harvey, “The Golden Dilemma,” NBER Working Paper 18706.

The Teck Hustlers Editorial Team covers technology, business, finance and gaming news for readers who want the story behind the headline. Every article is researched, written and edited by our in-house team, checked against company announcements, filings and reputable reporting, and updated when new facts emerge. We focus on what each development means for founders, professionals, investors and everyday users. Have a tip or a correction? Reach us through our contact page.